Patterns at GAStech
Jordie Chisam, Casey Mason, Zhengliang Liu
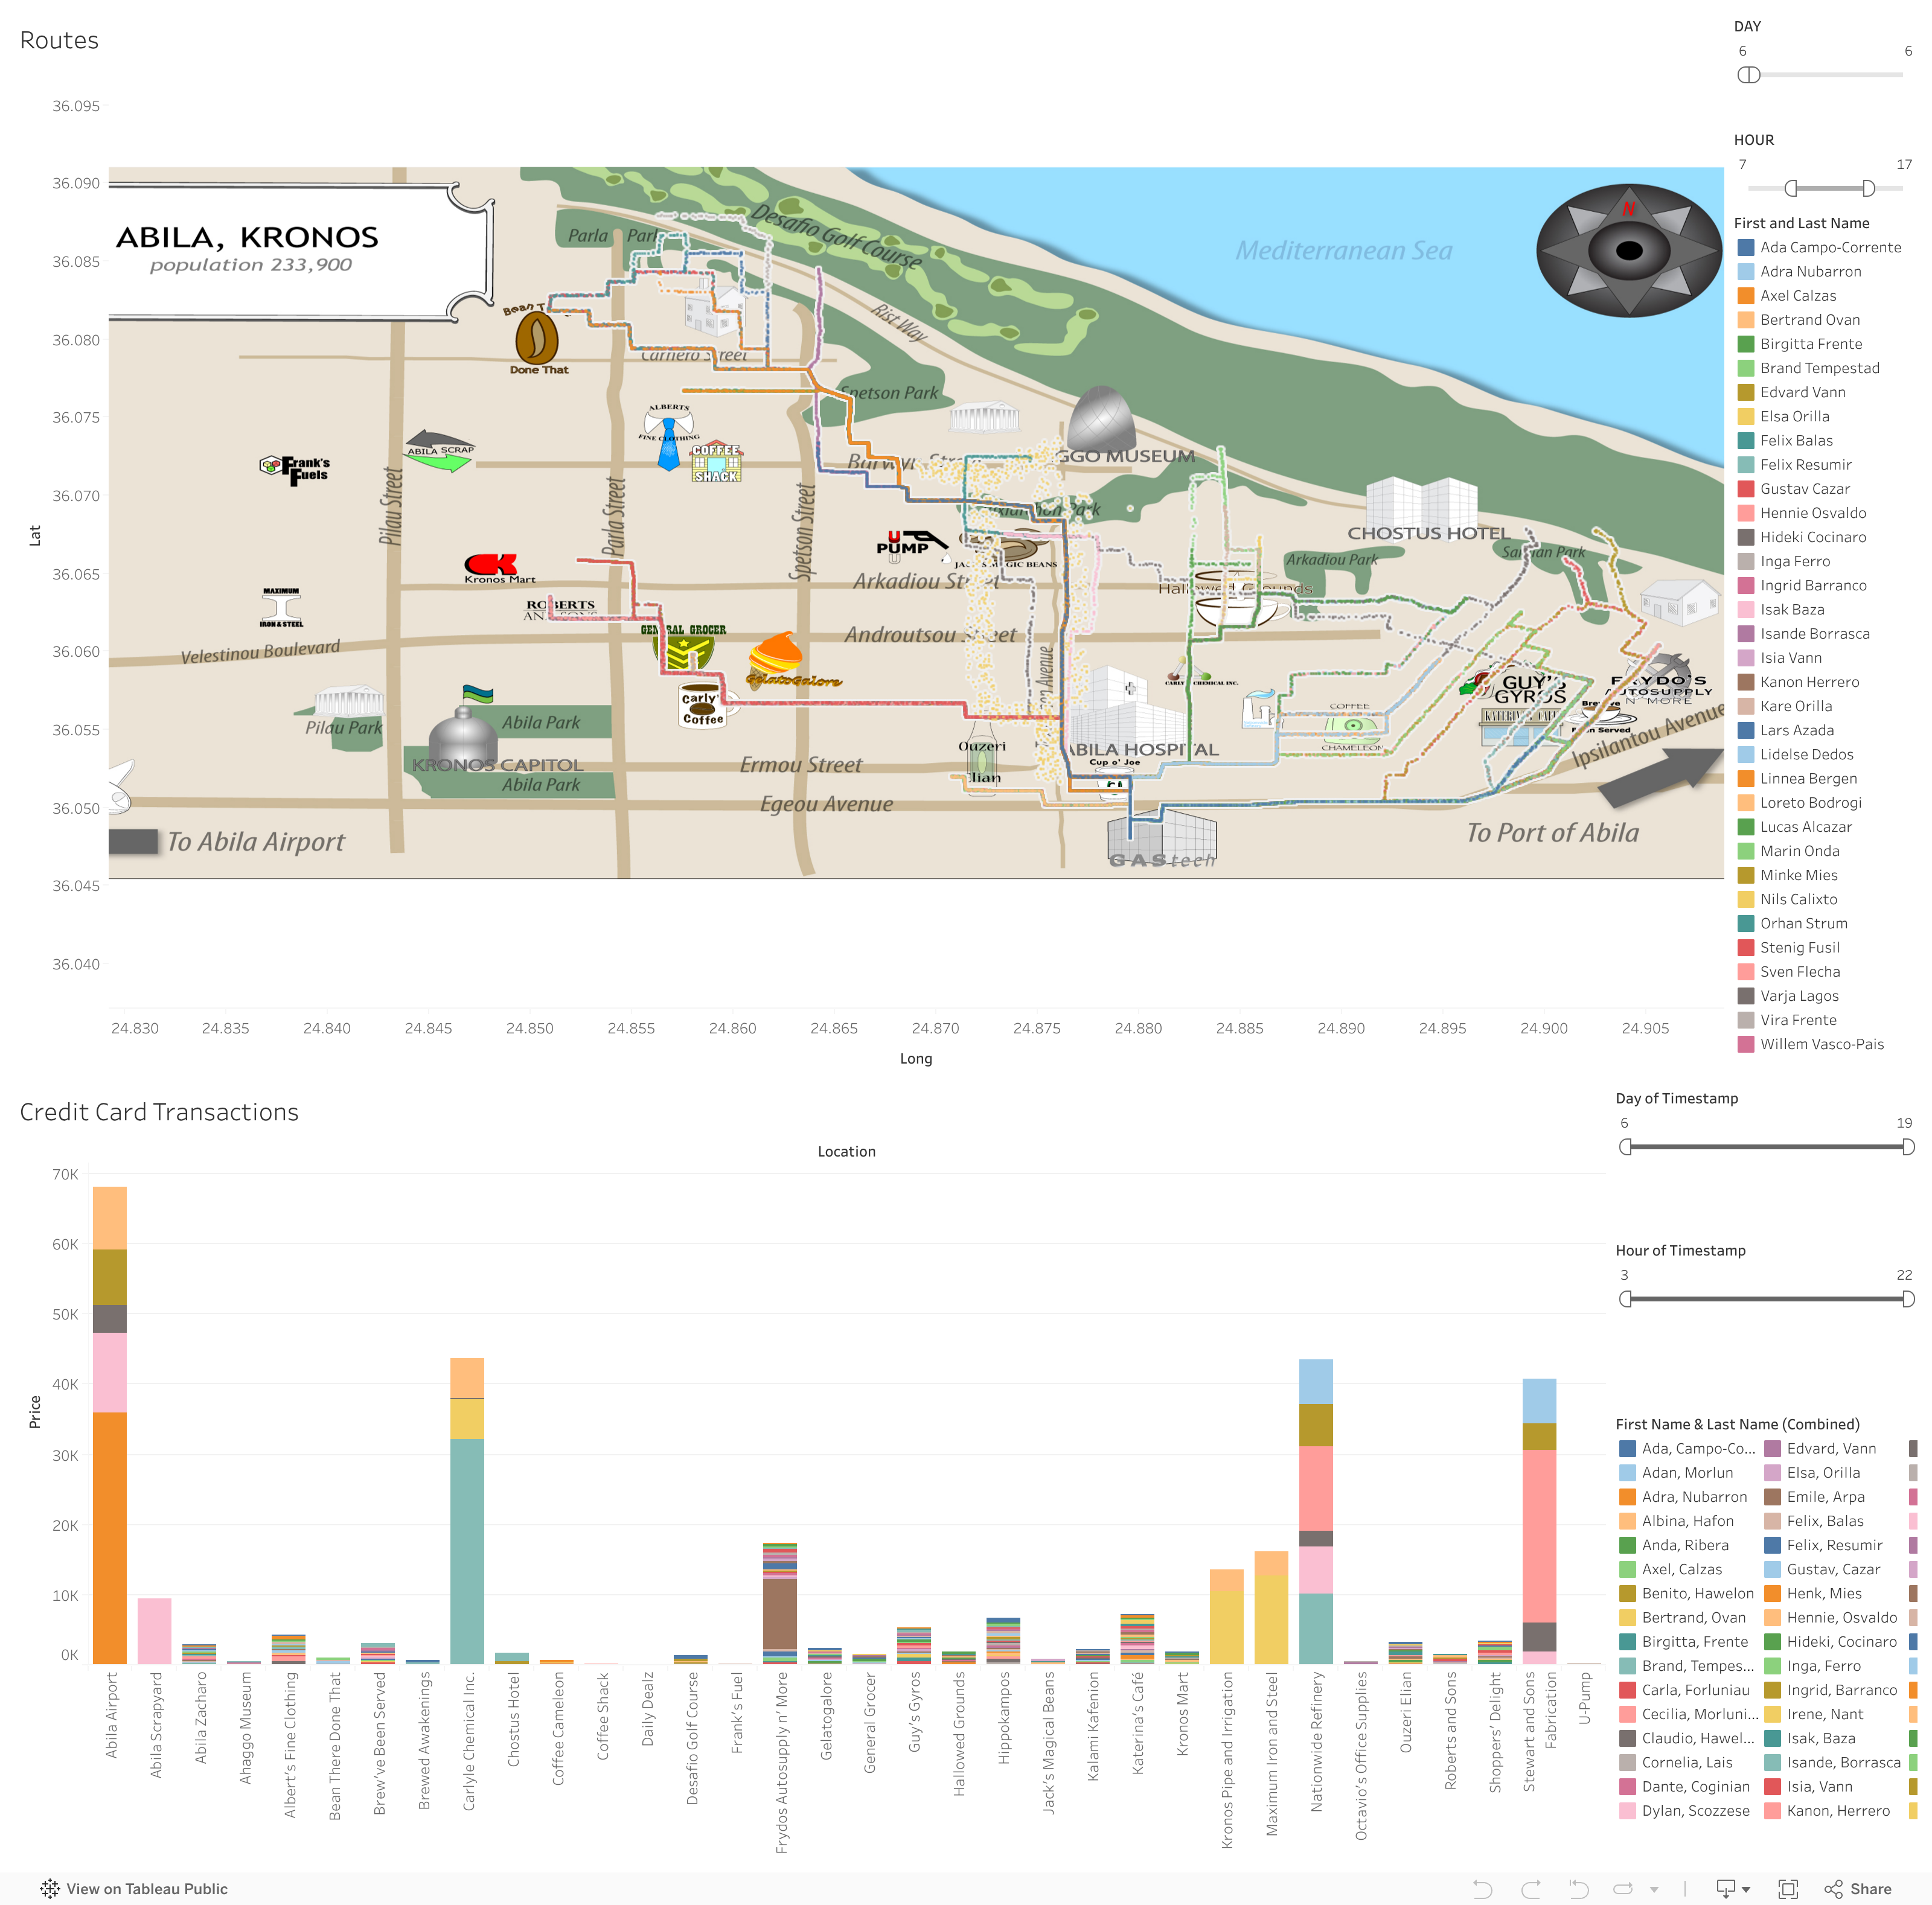
Use this visualization to identify suspicious patterns of behavior that may be related to the missing staff members at GAStech. All of these visualizations are interactive.
The first visualization depicts the vehicle routes of 36 GAStech employees for two weeks prior to the disappearance. To further explore the data table, use the filters on the right side of the visualization to change the day, time (military time in hours), and employee. The days and times can be adjusted by moving the slider. Then below the data and time, the employees are listed and can be clicked on to reveal only their routes. To select multiple employees at once, use Ctrl+Click or Command+Click depending upon your computer. Additionally, on hover, the colored routes will reveal the name, the latitude and longitude coordinates, and timestamp.
The second visualization displays the credit card transactions of each employee for two weeks prior to the disappearance. Similar to the first visualization, to explore the data table, use the filters on the right side of the visualization to change the day, time (military time in hours), and employee. The days and times can be adjusted by moving the slider. Then below the data and time, the employees are listed and can be clicked on to reveal only their routes. To select multiple employees at once, use Ctrl+Click or Command+Click depending upon your computer. Additionally, on hover, the colored square will reveal will reveal the name, location, price, and timestamp.